EV Charge
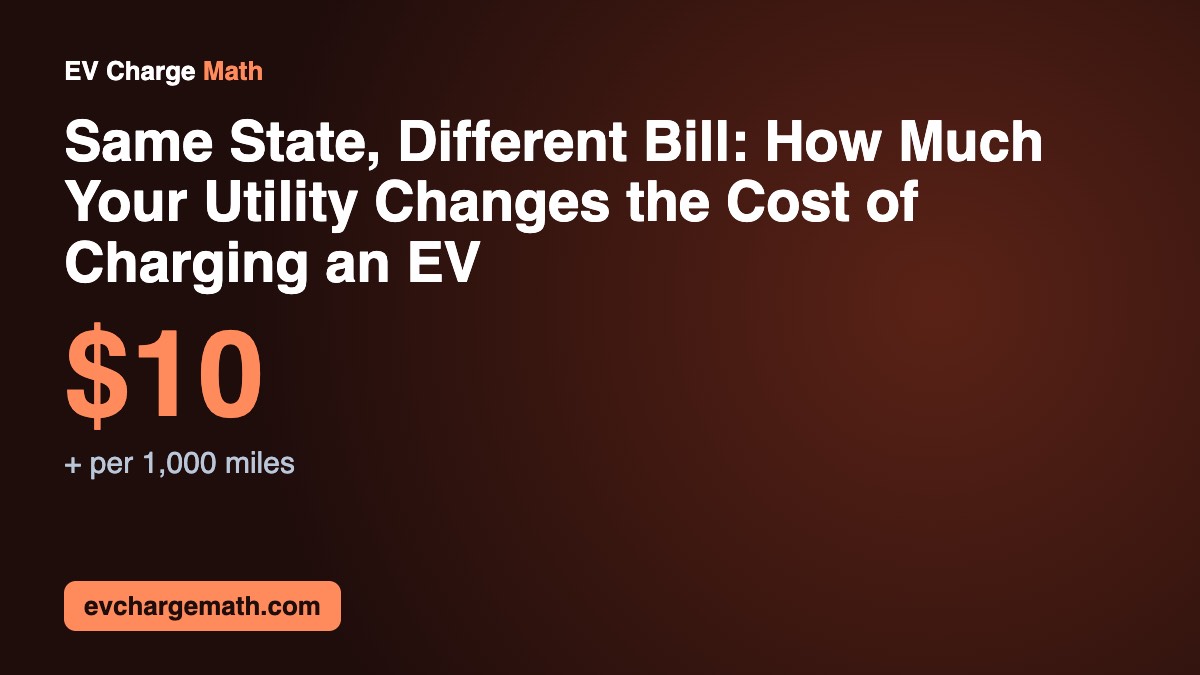
Most EV cost estimates, including the state pages on this site, start from one number: the state’s average electricity price. That average hides a lot. Inside a single state, the utility that happens to serve your street can change what you pay to charge by hundreds of dollars a year, for the exact same car and the exact same miles.
To measure how much, I took the estimated residential rate of every utility in our ZIP code database and compared the cheapest and the most expensive large utility in each state (only utilities that serve at least 25 ZIP codes, so tiny co-ops don’t skew it). The result: in 40 of 49 states the gap is worth $10 or more per 1,000 miles in a Tesla Model Y. The typical state gap is about $17 per 1,000 miles, or $203 a year at 12,000 miles.
The biggest gaps inside one state
| State | Cheapest large utility | Most expensive large utility | Gap per 1,000 mi | Gap per year |
|---|---|---|---|---|
| California | City of Anaheim (15.92¢) | San Diego Gas & Electric (40.60¢) | $68 | $814 |
| New York | Niagara Mohawk Power (20.20¢) | Con Edison (41.82¢) | $59 | $713 |
| Michigan | Cloverland Electric Co-op (17.12¢) | Upper Peninsula Power (32.92¢) | $43 | $521 |
| Maine | Eastern Maine Electric Co-op (22.55¢) | Versant Power (37.71¢) | $42 | $500 |
| Washington | Chelan County PUD (4.51¢) | Puget Sound Energy (17.99¢) | $37 | $445 |
| Iowa | North West Rural Electric Co-op (11.79¢) | Interstate Power and Light (22.79¢) | $30 | $363 |
| Illinois | MidAmerican Energy (12.17¢) | Shelby Electric Co-op (22.68¢) | $29 | $347 |
| Ohio | City of Columbus (13.72¢) | Buckeye Rural Electric Co-op (24.12¢) | $29 | $343 |
| Texas | Lyntegar Electric Co-op (9.58¢) | TXU Energy Retail (19.92¢) | $28 | $341 |
| New Mexico | El Paso Electric (11.81¢) | Springer Electric Co-op (22.10¢) | $28 | $340 |
| North Carolina | EnergyUnited Electric Membership Corp. (12.21¢) | Roanoke Electric Membership Corp. (22.36¢) | $28 | $335 |
| New Jersey | Jersey Central Power & Light (19.91¢) | Atlantic City Electric (29.79¢) | $27 | $326 |
California is the clearest case. A driver served by City of Anaheim pays roughly 16¢ per kWh, while San Diego Gas & Electric customers pay about 41¢. That’s $68 more for every 1,000 miles, around $814 a year, and both drivers would show up in the same “California average” of 29.75¢. City-owned utilities like Anaheim, Los Angeles or Sacramento tend to sit far below the big investor-owned ones.
New York tells the same story between upstate and the city: Niagara Mohawk Power at about 20¢ against Con Edison at 42¢, a $713 difference over a year of driving.
Washington has the cheapest large utility we found anywhere: Chelan County PUD, at about 4.5¢ per kWh, thanks to hydropower from the dams on the Columbia. A few hours west, Puget Sound Energy customers pay around 18¢, four times as much.
Texas is a special case. Most of the state has a deregulated market, so the rate depends on the retail plan you pick, not only on who owns the wires. Even so, the gap between a rural co-op like Lyntegar Electric Co-op (9.6¢) and TXU Energy Retail (19.9¢) is about $341 a year.
Where your utility barely matters
| State | Cheapest | Most expensive | Gap per 1,000 mi |
|---|---|---|---|
| Nevada | Sierra Pacific Power (12.31¢) | Nevada Power (13.00¢) | $2 |
| Idaho | Northern Lights (13.34¢) | PacifiCorp (14.05¢) | $2 |
| Vermont | Green Mountain Power (24.05¢) | Vermont Electric Cooperative (25.32¢) | $3 |
| New Hampshire | Public Service of NH (26.76¢) | New Hampshire Electric Co-op (28.15¢) | $4 |
| Tennessee | Middle Tennessee EMC (12.71¢) | Meriwether Lewis Electric Co-op (14.79¢) | $6 |
| Wyoming | Powder River Energy (13.57¢) | High Plains Power (15.86¢) | $6 |
In a handful of states the large utilities charge almost the same. In Nevada and Idaho the gap is under $3 per 1,000 miles, so the state average is a fair estimate and your rate plan (especially time-of-use) matters more than your address.
Why the same state can have such different prices
- Who owns the utility. City-owned utilities and rural co-ops don’t pay shareholders and often buy cheap federal hydropower. Large investor-owned utilities usually charge more.
- Where the power comes from. Hydro-heavy utilities in the Northwest are the cheapest in the country. Utilities that rely on imported natural gas pay more when gas prices rise.
- The cost of the wires. Delivery charges cover poles, lines and, in places like California, wildfire prevention. They can be half of the bill and they vary a lot by utility.
- Market rules. In deregulated states like Texas, the supply price depends on the plan you choose, so two neighbors can pay very different rates.
Alaska has the widest gap of all (Chugach Electric Association at about 25¢ against Alaska Village Electric Co-op at 83¢), but it isn’t comparable: rural Alaskan villages run on diesel generators, and a state program (Power Cost Equalization) lowers what many residents actually pay.
What this means if you own or want an EV
- Check your own rate, not the state average. Divide the total on your bill by the kWh you used. Our guide to finding your real rate shows how.
- Use your ZIP code. The calculator looks up your utility’s estimated rate and works out the cost for your car.
- Ask about an EV or time-of-use plan. Off-peak rates are often well below the averages in this article, especially with the most expensive utilities. See the time-of-use guide.
- Moving within your state? The utility can matter as much as the state itself. It’s worth checking before you compare housing costs.
How we calculated this
Utility rates come from NREL’s utility rate database (OpenEI, based on EIA Form 861, 2024), scaled to the latest EIA average residential price for each state (August 2026). These are average prices including all charges, not any specific tariff. We only compared utilities that serve at least 25 ZIP codes in the state. Costs use the EPA rating of a Tesla Model Y (27.5 kWh per 100 miles, charging losses included) and 12,000 miles a year. Full details on the methodology page.
Download the data
Free to use in your story, report or website under CC BY 4.0: just credit EV Charge Math with a link. Updated monthly (August 2026 data).
More EV charging data
- Cheapest states to charge an EV
- Most expensive states to charge an EV
- EV charging cost per month, by state
- EV charging cost per mile by state
- EV vs gas: fuel cost in every state
- Electricity cost per kWh by state
- How much it costs to charge a Tesla
- Tesla Supercharger cost by state
- How long it takes to charge an EV (Tesla and more)
- Level 2 charger installation cost by state
- EV charging cost by state (map)
- EV charging cost calculator
- Cost to charge every EV model
Sources: NREL/OpenEI U.S. Utility Rate Database; EIA Electric Power Monthly (August 2026); fueleconomy.gov.